A plot of the concentration profile (normalized with respect to Cs) , at various times, is given here.
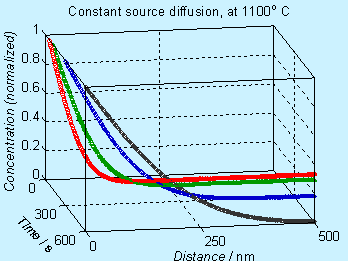

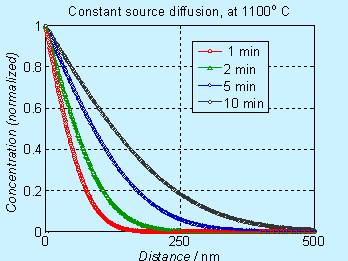
Figure 6.2. Concentration profile for doping by constant source diffusion
Note that the concentration axis is in linear scale. Many times, the concentration axis is in log scale and the figures will appear to be different, as shown below.
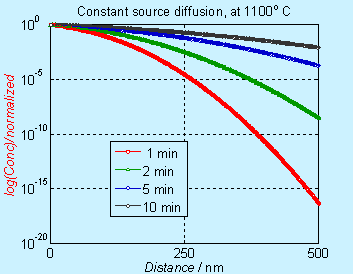
Figure 6.3. Concentration profile for doping by constant source diffusion (log scale)
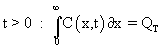
Limited source diffusion: In the second mode of diffusion called limited source or drive in diffusion, we assume that the source is a limited quantity of dopant, all concentrated at the surface. Thus, the quantity QT is given by
This is a reasonable approximation as long as the dopant is mostly restricted to the surface, in the beginning.
At any t >0, the total dopant inside the wafer is given by QT and this is given by
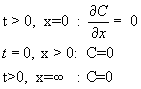
Similalry, the source is removed at t=0, and there is no flux  of dopant from outside, for t > 0. Initially (t=0), the concentration of dopant inside the surface (except on the surface) is zero. The concentration at a location too far away from the surface (inside the wafer) is zero. of dopant from outside, for t > 0. Initially (t=0), the concentration of dopant inside the surface (except on the surface) is zero. The concentration at a location too far away from the surface (inside the wafer) is zero.
These are reflected in the following equations.
It can be shown that the following Gaussian profile satisfies the differential equation and the boundary conditions.
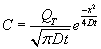
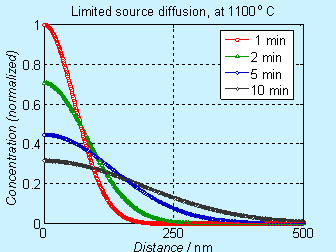
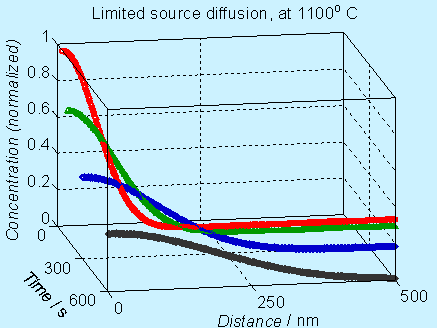
Figure 6.4. Concentration profile for doping by limited source diffusion
In log scale, the concentration profile appear to be different, as shown below.
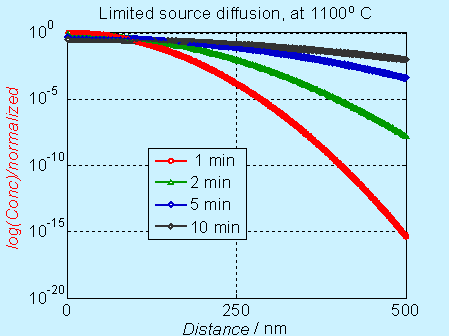
Figure 6.5. Concentration profile for doping by limited source diffusion (log scale)
Near the surface, the concentration decreases significantly with time, but it is not obvious in the log scale. The complementary error function (constant source diffusion) is a decreases faster compared to the Gaussian function (limited source diffusion). This is illustrated in the figure below.
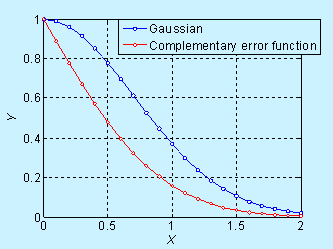
Figure 6.6. Comparison of concentration profile for doping by constant source diffusion and limited source diffusion
In log scale, it is given below
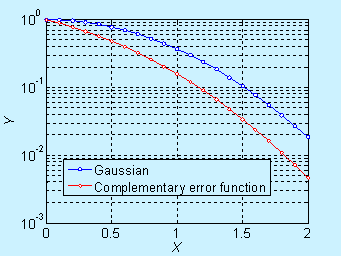
Figure 6.6. Comparison of concentration profile for doping by constant source diffusion and limited source diffusion (log scale)
|