|
2.14 Defect Equilibrium Diagram
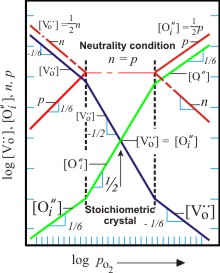
2.14.1 Frenkel defects dominating at stoichiometric composition
The following diagram is obtained when Frenkel defect dominates i.e. the internal disorder of the material dominates in the intermediate pressure range.
The best way to draw the diagram is to first draw the central region i.e. making Vo = Oi and then extend the lines of Vo and Oi into low and high pressure region with appropriate slopes depending upon the oxide stoichiometry. Then, draw the electron and hole concentrations, n and p, in the low and high pressure regions respectively since their relationship to Vo and Oi is straightforward. Then extend these in the intermediate region and low/high pO2 region depending according to the slopes obtained from the analysis. This process yields the diagram as shown in the figure below.
Figure 2. 6 Concentration of ionic defects vs pO2 with Oxygen Frenkel defects dominating at stoichiometric composition |
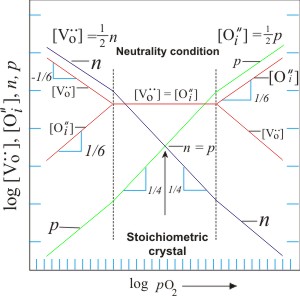
2.14.2 Intrinsic ionization dominating at stoichiometric composition
Using the proceedure similar to that explained in the previous slide except that in the central region now n=p as intrinsic ionization dominates at the stoichiometric composition, we obtained the following figure. There are subtle differences as we can observe by comparing the two figures.
Figure 2. 7 Concentration of ionic defects vs pO2 with intrinsic ionization dominating at stoichiometric composition |
|