| |
2.13.1.3 Stoichiometric Condition, i.e., Intermediate pO2
Case - I: Intrinsic ionization dominates i.e.
The defect reaction is
The corresponding reaction constant is
Here both ne and nh are independent of pO2 while the point defect concentrations are given as from (2.50)
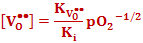
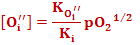
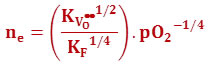
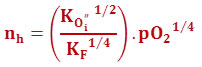
and from (2.51)
Case – II: Internal disorder and anti-Frenkel defects dominate i.e.
The reactions are
Now, since  and [ and [ ] are independent of pO2 , using (2.50) and (2.51) respectively, ne and nh are given as ] are independent of pO2 , using (2.50) and (2.51) respectively, ne and nh are given as
The above equations provide the limiting conditions of oxygen partial pressure separating three regimes of oxygen pressures with variations of defect concentration vs pO2 obtained. From this we can plot a defect concentration vs pO2 plot, also called as Brouwer’s Diagram. Such diagrams are extremely important in defect chemistry to understand the dominating defects which govern the physical processes.
|


 [
[